

Storytelling is an innate human skill and yet data storytelling is still an emerging concept!
By 2025, Gartner predicts data stories will be the most widespread way of consuming analytics. It’s a key part of modern analytics your business cannot afford to overlook.
Data storytelling is a method for communicating analytical information with a compelling narrative. Offering consumers valuable context which is memorable. It’s suited to all knowledge levels – business users and subject matter experts alike.
With data storytelling all users can:
- Provide context and relevance around the numbers
- Inspire discoveries in data with meaningful purpose
- Make information much more memorable and comprehensive for everyone
For example, take a typical retail dashboard that presents annual sales revenue for stores worldwide. Ordinarily it would be left to the individual to glean their own interpretations. However, with storytelling to explain the nuances, it reveals that one region’s spike in sales was attributable to seasonal factors.
Automatically, there is a greatly enhanced depth of understanding and more people able to derive the intended value from the data.
Stories are more than just a data description
As business leaders you need to base your strategic goals on more than just numbers. You require a holistic viewpoint, interpretations that make sense and an extra layer of detail to draw upon. A data story that adds expert opinion, past-experience and insight is what motivates the audience to take action.
The aim might be to surprise, delight or even alarm. In any case, bringing ‘big picture’ information to the forefront of your reporting is key to fully engaging your decision-makers.
Data acts as the trigger for creating a story, narrative is an anchor, but context is the magic ingredient to develop understanding.
Common use cases for storytelling tools
Modern embedded analytics platforms offer several narrative-building features which combine real-time data with rich information presentation options, without having to switch to using other tools.
This area of analytics is core to the Yellowfin suite, providing two useful products – Stories and Present – where users can build narrative-based reports and presentations within the same interface they build dashboards.
Built-in analytics features enable end-users to create and share knowledge and insights using long-form narrative. Augmenting their story with rich data (charts, reports) and non-data content (text, images, videos).
Useful when creating:
- operational reports
- multi-project data discoveries
- employee blogs and reports
- external partner and client reports
Make your data stories compelling
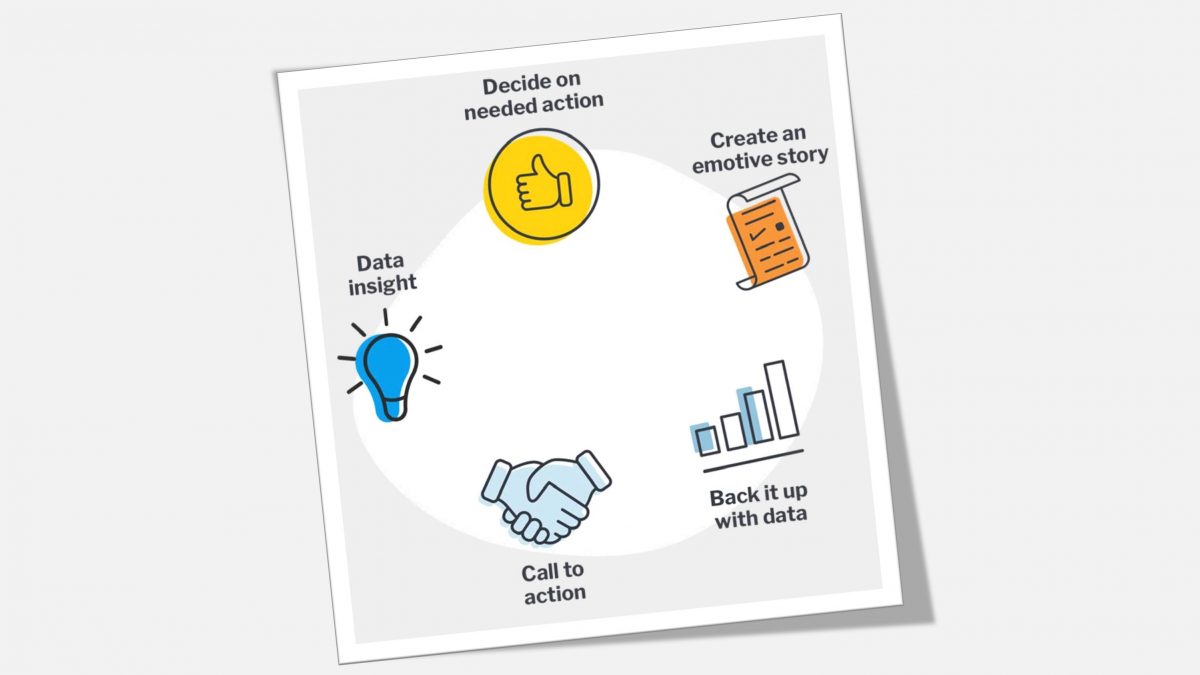
The primary aim of any data-driven narrative is to move people emotionally, and then back up their understanding with the facts. It reveals a truth that you need to communicate.
It could be in one long story format providing an overview, or multiple shorter snippets as you make your way through a set of facts. The point is to make it memorable and personal so that it resonates with your audience.
Here’s what to consider when forming your narrative:
- What does the data tell you?
- Is it a noteworthy change, pattern or trend over time?
- Is it a lesson in what ‘not’ to do?
- Is it a fact not widely known but one that people should be aware of?
Know your audience
Take time to consider the different types of people consuming your data and it’s context. Empathise with your audience and tailor the narrative and presentation according to their needs and understanding.
For example, if you’re presenting to senior executives bear in mind that their time is a precious commodity. They just want to glean the significance of weighted probabilities to make high level decisions, so only provide short, punchy stories backed up with data that point to definitive conclusions.
Data led cultures require inspiring role models
To successfully cultivate a data culture, leadership teams need to ‘walk the talk’.
As a leader it is your responsibility to become a data storytelling role model. By taking time to build a story and invite people on that journey with you, it empowers everyone in the business to start telling and sharing great stories. Together you can create a vision for the future, backed up by data that explains the strategy to achieving it including the what, why and how.
Traditional reports and dashboards simply don’t provide the full context for the data they share. By contrast, stories are incredibly powerful because they can evoke emotion and inspire a person to take action. It takes time to master the art, but when everyone understands challenges better and they can clearly identify opportunities for change, then business decision making becomes much easier.
Are you ready to persuade others to act on the insights you have discovered?
Tips on choosing the right analytics tool and how to successfully deliver your data stories can be found in our free eBook: ‘Once Upon A Time Series – Why Data Storytelling is Important’
OR why not see it in action and request a demo today.