What is it?
In a nutshell – a fully hosted and maintained Managed Service Analytics Solution. You can access it from anywhere without the overhead traditionally associated with hosting your own equipment and software.
Our solutions use technology strategies and tools to analyse business information. They provide historical, current, and predictive views of business operations.
Every business has large amounts of data. An effective solution will show you as a business leader, which information you need, why you need it, and more importantly what actions are required to proactively manage your organisation.
How it Works
There are three options open to you: Select, Professional and Enterprise.
Each one provides you with an easy expansion analytics tool. Hosted, maintained, targeted and priced according to your needs.
Select
Ideal for Small to Medium Enterprises (SMEs) – all the tools associated with an ‘Enterprise’ solution but at a fraction of the cost.
If you’re looking for an entry into the data analytics world, this one is for you. Providing all the features you could need.
To get going, sign up today and we’ll do the rest for you!
Professional
If you’re looking to evolve your analytics experience, this option offers you everything that’s included in Select plus more advanced features and functionality.
To get going, sign up today and we’ll do the rest for you!
Enterprise
This offering is completely tailored to your needs. The data solution has its own unique style and features but does pack some serious analytics punch.
The best way to get going is to contact us to discuss your specific requirements.
There’s no hard sell, just a simple chat to discuss your requirements, and an offer of our assistance if needed.
Select
Ideal for SMEs-
Hosting £35.00 per month
-
Fully Managed
-
Secure PostgresSQL
-
Multiple Connectors with Pre-built Content
-
Drag and Drop Report Builder
-
Over 50 Chart Types
-
Natural Language Query
-
Import CSV
-
External Connectors
-
Snapshot Backups of Uploaded Data and Instance
-
Up and running within 10 minutes
Professional
Next Level Analytics-
Hosting from £130.00 per month
-
*Everything from Select plus...
-
Auto Analysis
-
Present
-
Data Storytelling
-
Task Manager
-
Transformation Flows
-
Multi-tenancy
-
Custom Styling
-
Multiple Additional Database Connections
-
Broadcast and Alerts
-
100's of Chart Types
-
Private Server
Enterprise
Contact Us-
Enterprise BI on premise on cloud, embedded or standalone.
*Select and Professional features plus... -
Dedicated Account Manager
-
Telephone and Email Support
Feature Details
 Fully hosted and maintained analytics. Access it from anywhere without the overhead traditionally associated with hosting your own equipment and software.
 Highly Scalable Data Management in a Secure Cloud with AWS.
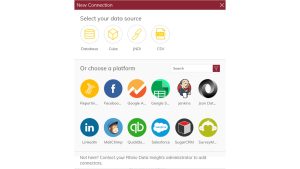 This allows users to connect directly to third-party web applications including Xero, Salesforce, Facebook, Twitter, YouTube, and Google Analytics, among many others.
Once connected, users can manipulate web-based data as if it was present in an on-premise database.
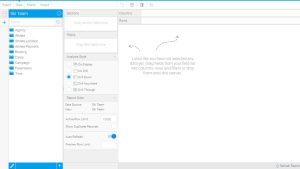 The Drag and Drop Builder allows users to use a pre-defined data view to build their reports without having to worry about SQL. This is the default builder, so once you’ve started the New Report creation process, you won’t have to select an advanced authoring option to proceed. From here you can start selecting the data set you wish to use for your report.
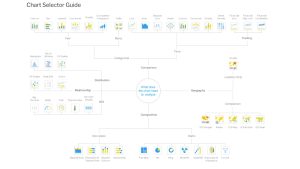 Charts are the foundation of all your analytics. Luckily, our charts look great straight out of the box, which means less time building content and less frustration with the workflow.
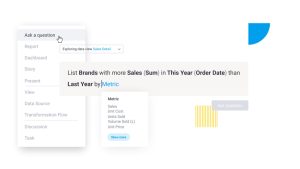 Natural Language Query (NLQ) allows a user to enter search terms or phrases as if they are speaking them naturally. This includes statements, questions or a simple list of keywords. Non-technical users can forge their own path through with any question they wish, choosing the suggested options that are offered to them.
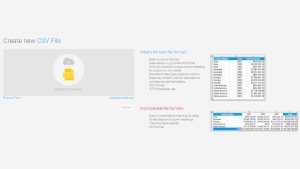 Our CSV functionality allows business users to transform their existing spreadsheets into reports. This means that any reporting capabilities can be quickly applied to spreadsheet contents, including the ability to drill down and categorise data.
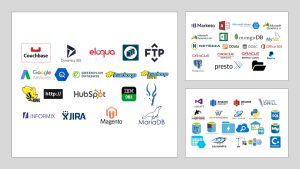 Our solution does not require you to import data, rather it works with data in your existing data sources.
Four main types of data store are supported: 1. JDBC compliant databases such as SQLServer, Oracle, Exasol, Snowflake, Redshift and many more 2. XML/A compliant cubes such as Microsoft Analysis Services, SAP BW, Oracle Essbase 3. CSV files (which are then loaded in to a relational database) 4. Third-Party sources including applications like Salesforce.com, Google Analytics and many others.
It uses meta-data to generate the appropriate, optimised queries for each type of data source. Data can even be obtained from a stored procedure that outputs a table object. Further, reports can be written that combine data from multiple data sources.
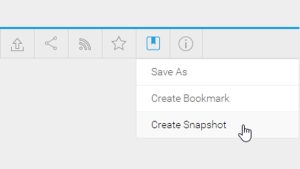 This allows you to save the result set of your current report with the drill paths and filters you’ve currently applied. A snapshot becomes a static report, meaning that you can no longer interact with it, it has been designed to preserve a result set at a point in time to use for comparison later.
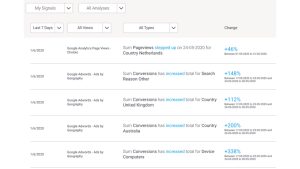 Advanced machine learning capabilities that assist users in the discovery and interpretation of data insights. These capabilities augment the capabilities of the user and enable them to analyse more data, find more insights and understand root cause – far faster than a human alone ever could.
Analysis tends to be time-series based and centred on key changes such as finding changes in total and average, trend direction, volatility, step shifts and outliers (spikes and drops). Typically these processes augment traditional methods such as dashboards and reports providing a richer analytics experience for end users.
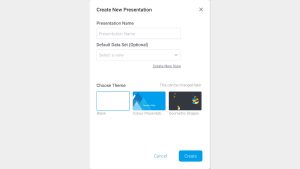 Present is a fully integrated presentation module designed for data led communications. This module contains functionality similar to that of the dashboard canvas. A presentation slide supports the use of multiple types of content, including live reports, text, images, shapes and icons, action buttons, filters, and even code widgets.
Note: Each presentation slide has the same functionality as a dashboard canvas, including support for multiple content widgets, as well as dual editor modes and a preview mode. The same holds true for developer centric technology, such as Code Mode (that allows you to view and edit slide code and its contents), and Code Widgets (reusable widgets that perform advanced, interactive coding functionality on a slide).
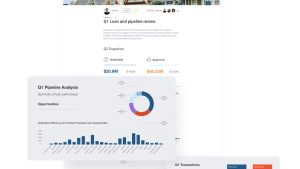 By combining real-time accessible data with insight, context and explanation, this feature makes analytics instantly more relevant, interesting and better understood. Whether you are giving a presentation or people are reading a data story, it really is the best way to share and collaborate on a single source of accurate, credible and secure information.
Plus anyone with a meaningful message can easily compose and share a Story. The simple interface springs data into life with images, video and embedded reports from other dashboard vendors.
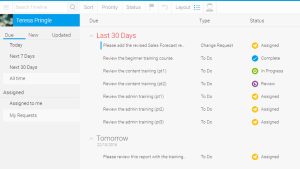 Tasks can be created and assigned to users for a variety of functions, covering simple ‘to do’ notes all the way through to data quality checks and content change requests. Each user then has the ability to manage both tasks they’ve requested, and tasks assigned to them, through their Timeline.
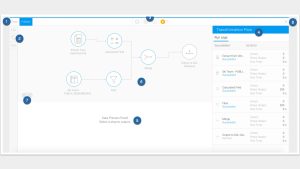 An integrated data extraction and transformation module to enable users to manipulate data into a format better suited to reporting and analytics. With this module, it is possible to extract data, transform it and then store the transformed data into a target database.
The Data Transformation module has a simple drag-and-drop builder to help you create Transformation Flows.
These flows consist of “steps”, each performing a different function. Following are the three main types of steps:
- Input steps: These steps allow you to extract data from any data source and import it into the platform to be transformed. This is the first step that you will need to configure.
- Transformation steps: allows you to transform your data in a variety of ways. This could be anything from aggregating your data to generating predictions based on data science models.
- Output steps: Once the data has been converted, it will need to be stored. Use the output step to load data into a database.
These steps can be joined up to configure complex flows which can then be run immediately, or scheduled to run at specific time intervals.
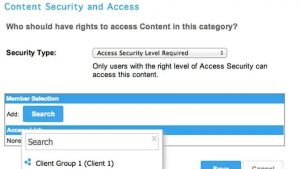 Allows multiple tenants within a single environment. This is primarily accomplished using a feature called “Client Organisations”. Client organisations provide each of your tenants with a siloed, secure, and customised experience within their own segment of the application, and offers several features for limiting user’s access to data at an organisational level.
All client organisations lie under a single primary “Parent” organisation that manages broad global settings, and provides an initial framework for content distribution.
Each user can belong to one or many client organisations, and which organisation they access in a given session is specified on login.
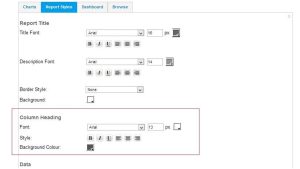 When creating dashboard content you are able to select from multiple layout options, these set a row and column-style layout such as full with column per row or 50% width columns two per row. The flexible option is a canvas dashboard which allows you to create your own layout within the canvas which allows you to have unlimited choice on the layout.
Using Dashboard Canvas, complex designs can be achieved with the ability to freely place a variety of rich content items in any position and to fine-tune the look and feel of those objects.
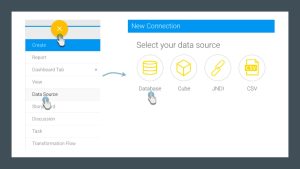 A Data Source record contains the connection details the system uses to access source data for reporting. Connections are then used by Views to provide tables and fields. Through the Admin Console you will be able to create new data sources and associated views. In addition you will be able to manage the security access to these connections.
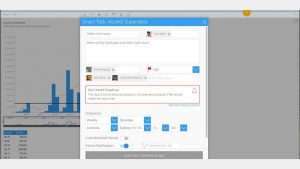 Keep everyone up-to-date on the daily, weekly or monthly results of the data with automatic broadcasts.
Broadcasting allows you to send a report to one or more users, based on a defined schedule and set of rules. A personal broadcast is exactly the same as a standard broadcast, with the exception of defining who it is sent to. A personal broadcast is only ever sent to the person that defined the broadcast.
 Charts are the graphic equivalent of tables and cross tab tables. Our solution has a very powerful and easy-to-use charting feature which enables you to produce sophisticated and visually appealing charts to display a simple summary of your data, or to represent complex relationships within it.
Once you have selected data for your report, you can visualise the data in many ways by altering the attributes within in the chart.
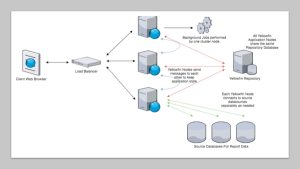 Our solution will work with all of the major cloud providers including AWS, Azure, GCP, and more.
It can be deployed into any environment as it is both OS agnostic and self-hosted.
This can range from physical servers on a private internal network, to highly dynamic cloud container services such as AWS ECS or Kubernetes.
Setting up a Data Analytics Solution Yourself
We understand this might be a tempting thought but before you make this hasty decision, take a look at our cost comparison guide below.
| Requirement | Description | DIY Estimate |
|---|---|---|
| Data Centre | Bandwidth, Compute Time, Environment, Power, Redundancy, Security | £4k up front + £1k per month |
| Hardware | Servers (ETL, DWH, Vis Tool), Storage, Network, Cables, Firewall | £30k up front + £1.5k monthly |
| Software | OS, Database License, ETL, DWH, Cube?, Vis Tool License | £30k up front + annual license fees |
| Development | Initial Data Prep., Solution Implementation & Development, Ongoing Consultancy | £40k up front + ongoing consultancy costs |
| Support | System Monitoring, Backups, Maintenance, End User Support | £7-8k monthly |
| £100k up front. £10k + monthly and annual license fees |
How We Can Help
We help you to unlock meaningful insights from your business data. By gaining a full understanding of your current and future goals, we can advise you on the best solution to fit your needs and budget.
Our team consists of specialist technicians, developers, consultants and analysts with an extensive and complementary skillset. They are on hand to assist you through each stage of the process from analysis, planning to installation and configuration.
If you already have a data analytics tool but not using it to its’ full potential, we will ensure you gain the best possible capability from your current implementation. This can be as simple as enriching your current dashboard and reports to better engage users. Perhaps you need help integrating the data platform with your company website, or you may require a full end-to-end solution.
Rhino Analytics Solution Overview
A customer recently asked us this question:
“How do we evolve past spreadsheets, leverage their content, and start to gain real insight into our data?”
Spreadsheets are convenient and easy but the problem is version control. Pretty soon you risk data continuity and governance because there are potentially several copies of the data.
The solution is simple: Integration. By ingesting the spreadsheet data directly into a data analytics tool, you can be confident you have only one true source of reports.
Software As A Service (SaaS) is the quickest route to leverage data. To do this we harness the power of ‘the cloud’. Utilising robust extract, transform and load (ETL) procedures for copying data from one or more sources into leading edge Enterprise Data Warehouse systems.
If you prefer to host on-premise we can help you put that together. However, our hassle-free service comes with flexible contract terms and a monthly price with no up-front fees.
Advantages of Our Solution
Speed – our proven Agile BI methodology and extensive use of automation means that you start seeing results immediately
Simplicity – analytics and Data Warehousing are notoriously difficult. We can take that headache away from you
Affordability – a fixed monthly rate with no upfront fees means no surprise expenditure
Quality Assurance – by managing the end-to-end solution we can ensure your service meets exacting industry standards
If you want to learn more about creating visually stunning dashboards with rich analytics and real time actionable information, please contact us.
