When making a fast food order do we then expect to receive a 3 course gourmet meal? Of course not, even if this may occasionally be a fleeting wish! So why do we get exasperated with the lack of detailed features on our mobile devices?
In the pursuit of instant access, product managers and developers are now required to keep remote workers quickly up to speed and agile. User experience for analytics on mobile and tablet devices is therefore a top priority. Their challenge is to somehow replicate the same relevant information that’s usually found on desktops.
Best practice for a ‘high level’ dashboard view requires a balance of context and relevance. The ability to slice and dice data, and clearly display charts on tablets is tricky, but even less amenable to mobile phones. As with all mobile apps, there is less screen ‘real estate’ available with only specific functions on offer. When users are on the move, mobile dashboards can only provide a ‘current status’ overview. Charts are minimal and the lack of ‘hover’ function allows for limited interactions.
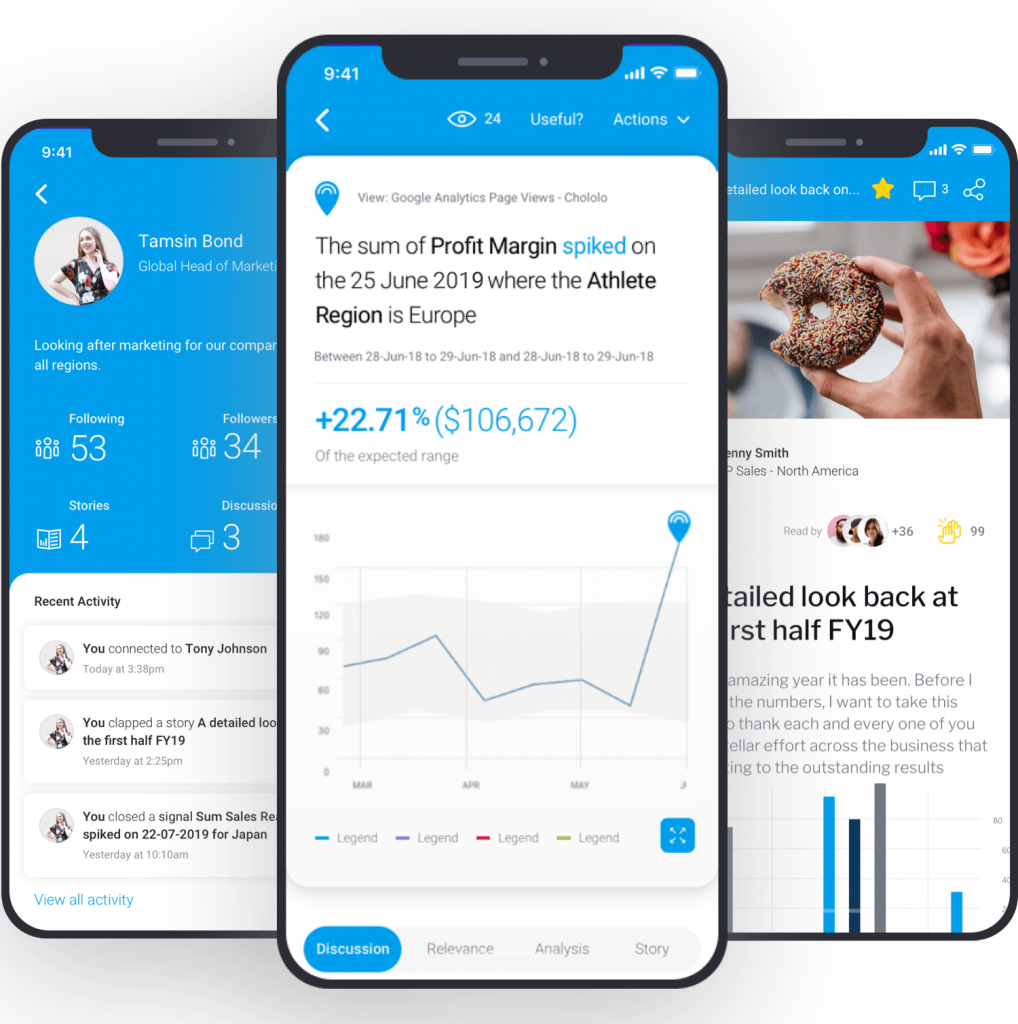
In our recent blog post about data storytelling we explain how Yellowfin Stories instantly creates more relevant, interesting and better understood analytics. Another advantage to this tool is how it easily lends itself to mobile devices. Notice how social media apps successfully present stories in an easily digestible way, while still preserving the wider context. Yellowin Stories can mimic this with data mobility. Developers just need to consider size restrictions and be mindful of which data to display and how it can be navigated.
Better yet, why not have your BI platform automate data discovery by trawling your business data for statistically significant changes, notifying users of those relevant to their role. This type of ‘news flash’ data can be presented without the need for specific dashboard or ‘card’ design, meaning that trend changes, period comparisons, spikes, dips and more can be accessed from mobile devices.
Find out how RhinoIT can help you unlock meaningful insights from your data.

Next, we discuss Preparation.
In the meantime, please leave us a comment or question
Main image designed by rawpixel.com & starline / www.freepik.com

