Categories
Analytics Business Intelligence Digital Transformation

BI-As-A-Service – the new technological frontier

Data, data everywhere. But what are we supposed to do with it all?

ERP, project management and business platforms have got increasingly sophisticated over the last few years, and this means businesses have access to an exorbitant amount of data.

This in theory is a great thing as data is of course the catalyst for measuring, improving and making better business decisions.

Dumb data

However, data – left in its raw or primary form – is of little use to a boardroom looking for direction. It needs to be processed securely, applied relevantly and interpreted with accuracy if it is to become at all insightful.

This is where business intelligence analytics – or BI analytics software – comes in to play.

Through the process of retrieving, analysing, transforming and reporting; BI analytics helps turn raw data into useful information. This in turn can then be reviewed and harnessed to make the type of business decisions that will see a business thrive.

Big BI benefits

Connected to an enterprise resource planning system (ERP), project information management platform (PIM) or business solution, BI analytics will help improve:

  • Clarity:

Sorting through a wealth of data to get to the gold is one-way BI analytics software will contribute to decision making that is based on fact and not assumption.

  • Insight:

From prospective reporting to prescriptive advice, BI analytics will process the data in a way that is meaningful and relevant to your business.

  • ROI:

Whether it’s through greater operational efficiency or earning greater return on your marketing investments, the insight offered up by BI analytics will contribute to increased revenue and margins. 

  • Customer service:

Customer profiling leads to greater consumer understanding. BI analytics will help you set – and deliver – on client expectation and meet market need time and time again.

  • Productivity:

Automated reporting means less time pulling together documents for staff. BI facilitates ‘one-click’ reports and quick view dashboards that can easily be shared with clients and colleagues.

Cloud challenges

BI analytics is of course nothing new and companies have been integrating platforms into their ‘on-premises’ business systems for years.

However, as more and more tech applications move into the cloud, compatibility has become a big issue and integrating software-as-a-service – or SAAS – applications which operate in real-time brings with it a level of complexity beyond on-premises integrations.

Yet, thankfully things are starting to change.

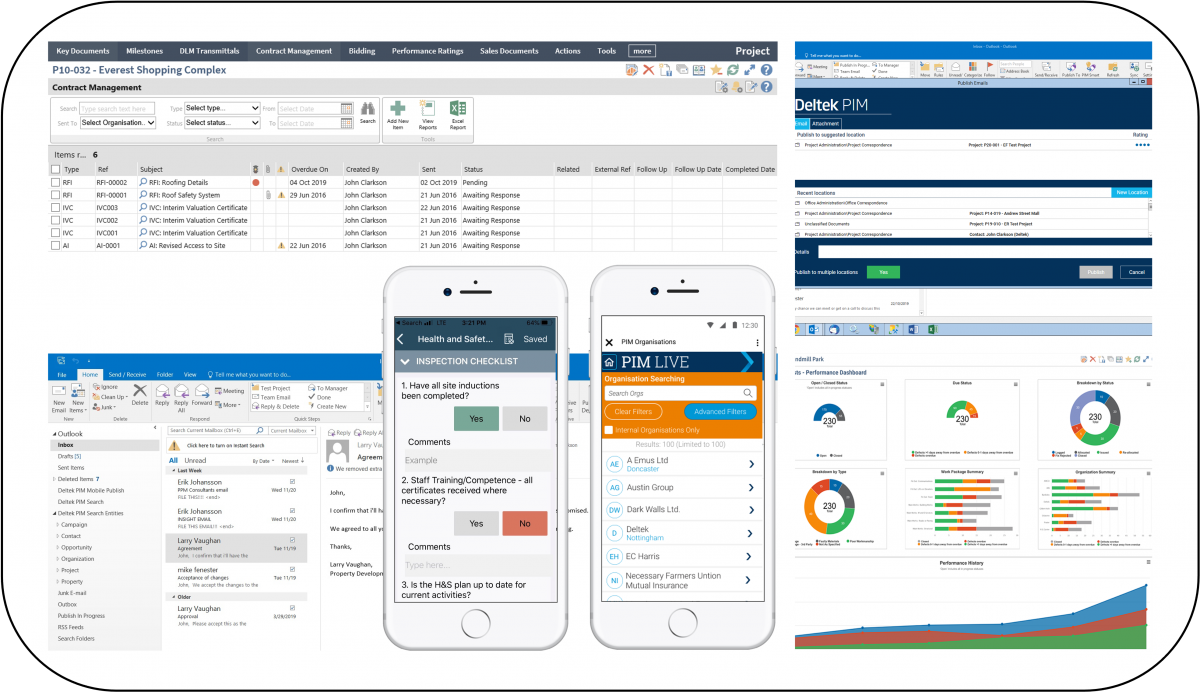
Now, thanks to developments in the software integration sector, it’s now possible to connect a cloud-based project management system like Deltek’s PIM with Yellowfin cloud based BI analytics.

The result is BI-As-A-Service, or BAAS.

Connected Data

One such company that has transformed its operations to include a cloud-based BI platform is data enabled debt prevention company Connected Data.

Connected Data wanted a technology partner to develop a BI platform and provide ongoing support with the objective of improving the customer experience, simplifying the deployment of predictive data and removing ‘data noise’.

The company joined forces with RhinoIT to develop a unique portfolio platform with dedicated BI development, consultancy and ongoing support service that will help to profile customers on credit history, lifestyle and past and present financial situation.

Now, with the power to make more informed customer decisions using a complete holistic business intelligence solution, the company is helping customers make substantial savings due to debt prevention yields.

The new frontier

BI analytics might have been around for a while, however the new frontier in BI analytics integration is connecting applications for cloud-based solutions.

If you are a company that relies on cloud-based ERP or PIM to run your business and want to understand the potential of BAAS, then please get in touch with RhinoIT on +44 (0)1908 881003 or hello@rhinoit.co.uk.


Categories
Analytics Big Data Business Intelligence Data Insights Digital Transformation

Transforming PIM

RHINOIT ANNOUNCES PARTNERSHIP WITH DELTEK

Enhancing Project Information Management systems with smart analytics

MILTON KEYNES – 12 May 2021 – RhinoIT Business Intelligence Solutions, a technology company helping organisations transform data into insight, is delighted to announce their partnership with Deltek, the leading global provider of enterprise software and solutions for project-based businesses.

Deltek Project Information Management (PIM) is a solution for architecture, engineering, and construction firms to access project information in one central location saving time with easy access to project emails, documents, and drawings. The central location aids in reducing corporate risk and improving team collaboration.

RhinoIT already work with customers who have deployed PIM. Together they have successfully built smart and agile data reporting systems, tailored to unique requirements and providing real-world functionality. Becoming a Deltek partner will further enhance RhinoIT’s service capability, making it possible to offer specialist knowledge in PIM.

“By combining leading edge technology with specialist Business Intelligence expertise, our goal is to help organisations drive meaningful change,” said Carl Edwards, CEO of RhinoIT. “We can help clients enhance existing report systems by transferring PIM data into their BI tool, and release constraints to include additional sources of data.” 

Learn more at www.rhinoit.co.uk/deltek-pim

Categories
Analytics Big Data Business Intelligence Data Insights Data Visualisation Digital Transformation

Insights that find you

Rhino Data Insights (RDI) is our full suite Business Intelligence platform with automated insights and smart analytics. A ‘one-stop’ integrated solution with Yellowfin at its core.

Our BI experts have built up practical ‘know-how’ on what works. We love sharing these valuable lessons with clients and have proven that any BI infrastructure can be up and running in 5 steps.

RDI tried and tested process of transforming data into insight:

  1. Discover – establish BI needs and map out effective strategy
  2. Identify – connect with key stakeholders to ensure successful implementation
  3. Structure – configure the appropriate BI environment (cloud/on premise)
  4. Systems – understand data sources and ensure they work collaboratively
  5. Implement – continue to monitor effectiveness and plan out further enhancements as and when necessary.

In our previous post Build meaningful data we explained how many UK construction companies are already working with us to release the full potential of their BI software. These companies, like so many, use large amounts of data.

To pick out every single insight can be a complex and time-consuming challenge. RDI can help solve this issue!

RDI incorporates a fantastic feature called ‘Signals’. Our BI experts can advise you on how to make use of machine learning and AI to further enhance your data analysis.

Signals is a standalone product that can work alongside your existing BI tool and provides reasoning behind obscure data findings. It automatically monitors your data so that you know when and why important changes happen to your business. Combined with actionable dashboards you can make more informed decisions.

For the known – you can receive notifications for custom alert conditions when threshold values are hit.

For the unknown – Signals uses automation and AI to trawl your data for statistically significant changes, notifying you of the ones that are relevant.

Trend changes, period comparisons, sudden spikes, dips and other outlier metrics come complete with plain English explanations. With additional analysis on correlated data changes that help you quickly get to the root cause.

There’s no need to build a report or dashboard to track every possible data combination – just point Signals directly at your data source –  and let insights find you!

Would you like to uncover hidden data and further enhance your business analysis? Please contact ian.l@rhinoit.co.uk

Categories
Analytics Big Data Business Intelligence Data Insights Data Visualisation Digital Transformation Technology

Transforming debt prevention

We are proud to be Technology Partners with newly launched company Connected Data. An exciting innovation that offers data-driven Business Intelligence solutions, transforming the way organisations prevent and reduce debt. 

This project is a perfect example of our expertise in building bespoke software that makes a meaningful difference to the finance industry. Making it possible to blend latest, trending customer data with AI driven data analysis to provide a unique portfolio platform.

The Connected Data story is covered in more detail in Credit Connect, Credit Strategy and CCR Magazine

Categories
Analytics Big Data Business Intelligence Data Best Practice Data Visualisation Digital Transformation

Prepare data that’s fit for consumption

When creating a meal the Chef carefully considers the correct mix of essential ingredients. Ensuring the meal not only looks and taste great but also provides the optimum health and nutrition.

This is also true for business intelligence data preparation. Organisations need to consolidate essential information from disparate sources, in a way that provides satisfying insights without bloating their database systems.

Data comes in all shapes and sizes – images, spreadsheets and other real-time sensor systems. It therefore requires intense attention to get them to work collectively.

What is Data Preparation?

It’s the act of manipulating (pre-processing) raw data (from disparate data sources) into a form that can readily and accurately be analysed. It is the first step in any analytic project and includes many discrete tasks such as; data loading, ingestion, cleansing, fusion and augmentation.

The aim of which is to produce accurate, consistent and comprehensive data for the organisation to base business decisions on.

A logical approach to this process will likely include the following steps:
Prepare data that's fit for consumption RhinoIT

Data Strategy – identifying the scope of the project and creating a workflow of requirements. This is like the Chef obtaining the ingredients for the recipe and understanding the cooking method

Data Collection – defining required data and gathering it from the various sources. ETL (Extract, Transform and Load) plays a key role in data integration, making it possible for different data types to work together.

Data Preprocessing – formatting and cleansing raw data by adding missing values, reducing duplicates, labelling metadata with categories and sampling into smaller memory sizes. Generally reworking real world data into an understandable format.

Data Transformation – reorganising data in such a way that users can use the database properly for further queries and analysis – usually known as ‘normalising’. Breaking complex data into smaller and more manageable parts for easier examination and design.

The good news is that RhinoIT can cook your dinner for you!

Data preparation may sound time consuming, however the production of enriched, accurate data is crucial for the success of your Business Intelligence projects.

Our data team can provide your users with powerful analytics by automating this lengthy and manual process, saving the organisation time and money. 

To find out how we can transform your data into stunning visualisations, please contact ian.l@rhinoit.co.uk.

Categories
Analytics Big Data Business Intelligence Data Best Practice Data Insights Data Science Data Visualisation Digital Transformation Technology

Can’t see the view for the fields?

Can you ever imagine a time without spreadsheets? They don’t appear to be going away anytime soon, and for good reason. Most businesses hold historical data within them, and let’s face it, they are a snap to create. However, in today’s fast-paced world of data consumption via dazzling pretty pics our trusted friend ‘the spreadsheet’ may start to leave us a little flat!

“So how do we evolve past spreadsheets, leverage their content, and start to gain real insight into our data?”

At RhinoIT, we were recently asked this question by one of our customers.

Yes, spreadsheets are convenient and easy. Almost everyone has a spreadsheet system installed on their computer ready to use. Unfortunately, this blessing can also be a curse. If every member of your team has access to the same spreadsheet, it’s likely to result in more than one version of your data existing. Unless you have a ‘Mary Poppins’ stance to document housekeeping, this poses an issue with continuity.

One version may have today’s data, while another version holds all the aesthetically pleasing column and cell updates made yesterday. How do you decide which version to use? Something as simple as a misplaced decimal point, deletion of cell, column or row can have an adverse impact on the integrity of your spreadsheet. Changing a positive value to a negative value or adding a new worksheet can also wreak havoc with your best-laid plans.

“If spreadsheets are here to stay, then how do we work around these issues for the foreseeable future?”
The answer is: Integration.

In the case of our customer, we weren’t suggesting a complex solution, quite the opposite. By merely ingesting the data directly from their spreadsheets into a Business Intelligence tool they were able to satisfy their end user requirements.

The result was an effective dashboard with all the requested data views and visualisations. Data could still be collected within spreadsheet fields but with the added benefit of security, governance and one true source of historic reports.

Have you recently struggled getting to grips with business data? What has your experience been with gaining more insight? We would love to hear from you. Please leave us a comment or question


Main image designed by upklyak / www.freepik.com